When Is an Outbreak Controlled?
Many countries around the world are struggling with the question of when and how to reopen the country after lockdown. Many, including the UK and Germany, have come to rely on a parameter called R or R0 as a benchmark for reopening and staying open. What makes R so powerful? In epidemiology, R0 is
the pathogen’s basic reproduction number and represents the number of new
infections caused, on average, by a single contagious person. R, or the effective reproduction number
(sometimes designated as Re or Rt), will start at R0
and should decline over time as the population gets infected, builds immunity,
and mitigation measures are activated.
Given this wide variability in estimating R, with one model saying no and another saying yes, we prefer to go back to the original US recommendation for benchmarking safe reopening strategies. One of its gating criteria simply requires that states demonstrate 14 days of declining confirmed case count. By this measure, Florida was one of the first of a handful of states to qualify. Now two weeks later, Florida wants to move on to phase 2. The figure below shows that as of May 1st, the state met the criterion for phase 1, and as of May15th it failed the same criterion to open further. While we expected this might happen as the state tested more widely, it would seem wiser for the state to proceed more cautiously. After all, if the outbreak does return, i.e. R > 1, the need to shut down again could cost more in the end.

R = (1 - P) x R0,
where P is the percentage
of the population that is immune or out of the pool of susceptible individuals. If 60% of the population is vaccinated or
isolated then only 40% can be infected and R is only 0.4R0. R0 of the novel coronavirus has
been variously estimated at between 1.5
and 3.5, with the WHO currently estimating 2.0 to 2.5. When R is reduced below one,
a contagious person can infect just one other person and the number of newly
confirmed cases stabilizes and declines, and the outbreak can be short-circuited. When R0 is 2.5 the above equation requires
that 60% of the population get infected to achieve “herd immunity” to control an
outbreak. This does not end the infection which in this example would continue until 88% of the population is infected.
Measuring R0 is therefore very important but estimating its
value, while the pandemic is raging, is problematic and highly model or
assumption dependent.
As an example of the wide range of estimates possible for R, we look at two models. One of the more
interesting infectious disease forecasting website is EpiForecasts which
provides models of the COVID-19
pandemic for hundreds of countries and subnational regions including all
the states
in the US. They currently estimate R,
the effective reproduction number, for the US at 1.04 (with a 90% confidence range
of 0.9 to1.2). A few states such as New Jersey have R < 1, but most states have R >1 such as Florida at 1.1 so their expectation is that case counts will increase as
the states reopen. Their forecasts appear
to be slightly more pessimistic than the widely followed IHME
model and others who increased case and death count forecasts after states started to
reopen two weeks ago. A few models, such
as Rt Covid-19, are more sanguine and
estimate a lower R for the US as a whole (~0.85) and R > 1 for only one
state, Minnesota. Their model suggests that the COVID-19 infection is under control in the US and states are safe to open. Their model for
Florida shows a current estimate of 0.89, increasing slightly and with widening uncertainty
after the state reopened recently.
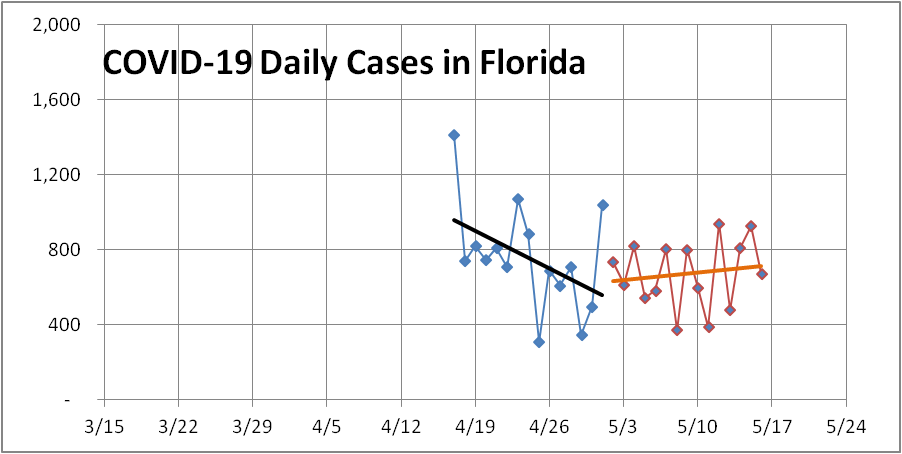
Given this wide variability in estimating R, with one model saying no and another saying yes, we prefer to go back to the original US recommendation for benchmarking safe reopening strategies. One of its gating criteria simply requires that states demonstrate 14 days of declining confirmed case count. By this measure, Florida was one of the first of a handful of states to qualify. Now two weeks later, Florida wants to move on to phase 2. The figure below shows that as of May 1st, the state met the criterion for phase 1, and as of May15th it failed the same criterion to open further. While we expected this might happen as the state tested more widely, it would seem wiser for the state to proceed more cautiously. After all, if the outbreak does return, i.e. R > 1, the need to shut down again could cost more in the end.


Comments
Post a Comment